# Atlas notebooks
***
> This notebook reproduces and extends parts of the figures and products of the AR6-WGI Atlas. It is part of a notebook collection available at https://github.com/IPCC-WG1/Atlas for reproducibility and reusability purposes. This work is licensed under a [Creative Commons Attribution 4.0 International License](http://creativecommons.org/licenses/by/4.0).
>
> 
GeoTIFF file post-processing: Spatial operations#
22/09/2020
M. Iturbide (Santander Meteorology Group, Instituto de Física de Cantabria, CSIC-UC, Santander, Spain)
This notebook illustrates a few steps to obtain a given spatial subset from a GeoTIFF file downloaded from the Interactive Atlas using climate4R [SantanderMetGroup/climate4R]and rgdal [CRAN - Package Rgdal].
Load libraries#
library(transformeR)
library(loadeR)
library(loadeR.2nc)
library(geoprocessoR)
library(visualizeR)
library(RColorBrewer)
library(sp)
library(rgdal)
Show code cell output
    _______   ____  ___________________  __  ________
   / ___/ /  / /  |/  / __  /_  __/ __/ / / / / __  /
  / /  / /  / / /|_/ / /_/ / / / / __/ / /_/ / /_/_/
 / /__/ /__/ / /  / / __  / / / / /__ /___  / / \ \
 \___/____/_/_/  /_/_/ /_/ /_/  \___/    /_/\/   \_\

      github.com/SantanderMetGroup/climate4R
transformeR version 2.1.3 (2021-08-04) is loaded
WARNING: Your current version of transformeR (v2.1.3) is not up-to-date
Get the latest stable version (2.1.4) using <devtools::install_github('SantanderMetGroup/transformeR')>
Please see 'citation("transformeR")' to cite this package.
Loading required package: rJava
Loading required package: loadeR.java
Java version 11x amd64 by Azul Systems, Inc. detected
NetCDF Java Library v4.6.0-SNAPSHOT (23 Apr 2015) loaded and ready
Loading required package: climate4R.UDG
climate4R.UDG version 0.2.3 (2021-07-05) is loaded
WARNING: Your current version of climate4R.UDG (v0.2.3) is not up-to-date
Get the latest stable version (0.2.4) using <devtools::install_github('SantanderMetGroup/climate4R.UDG')>
Please use 'citation("climate4R.UDG")' to cite this package.
loadeR version 1.7.1 (2021-07-05) is loaded
Please use 'citation("loadeR")' to cite this package.
geoprocessoR version 0.2.0 (2020-01-06) is loaded
Please see 'citation("geoprocessoR")' to cite this package.
visualizeR version 1.6.1 (2021-03-11) is loaded
Please see 'citation("visualizeR")' to cite this package.
rgdal: version: 1.5-16, (SVN revision 1050)
Geospatial Data Abstraction Library extensions to R successfully loaded
Loaded GDAL runtime: GDAL 3.2.1, released 2020/12/29
Path to GDAL shared files: /home/phanaur/mambaforge/envs/tfg/share/gdal
GDAL binary built with GEOS: TRUE
Loaded PROJ runtime: Rel. 7.2.0, November 1st, 2020, [PJ_VERSION: 720]
Path to PROJ shared files: /home/phanaur/mambaforge/envs/tfg/share/proj
PROJ CDN enabled: TRUE
Linking to sp version:1.4-5
To mute warnings of possible GDAL/OSR exportToProj4() degradation,
use options("rgdal_show_exportToProj4_warnings"="none") before loading rgdal.
Load GeoTIFF data#
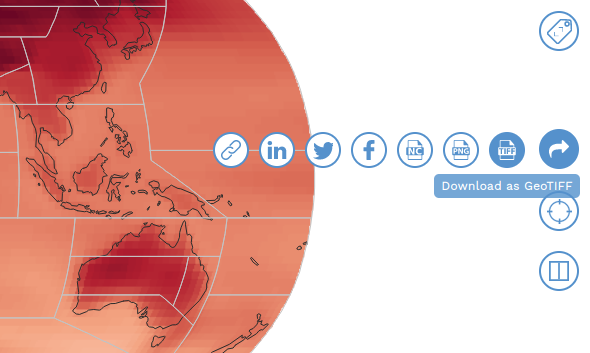
GeoTIFF is a public domain standard to embed georeferencing information into TIFF image files. This image format is provided by the Interactive Atlas and it can be read with the rgdal library. Here, we use the CMIP5 Mean temperature Change (deg C) for RCP 8.5. To obtain the file loaded here, or any other, select the Download as GeoTIFF option in the Interactive Atlas.
map <- readGDAL("auxiliary-material/CMIP5 - Mean temperature (T) Change deg C - Long Term (2081-2100) RCP 8.5 1986-2005 - Annual (mean of 29 models).tiff")
Show code cell output
auxiliary-material/CMIP5 - Mean temperature (T) Change deg C - Long Term (2081-2100) RCP 8.5 1986-2005 - Annual (mean of 29 models).tiff has GDAL driver GTiff
and has 90 rows and 180 columns
In order to continue with climate4R, first, we need to convert map to a climate4R grid object.
delta <- sgdf2clim(map)
Show code cell output
NOTE: One single grid passed to the function: nothing to bind, so the original grid was returned
Basic display examples#
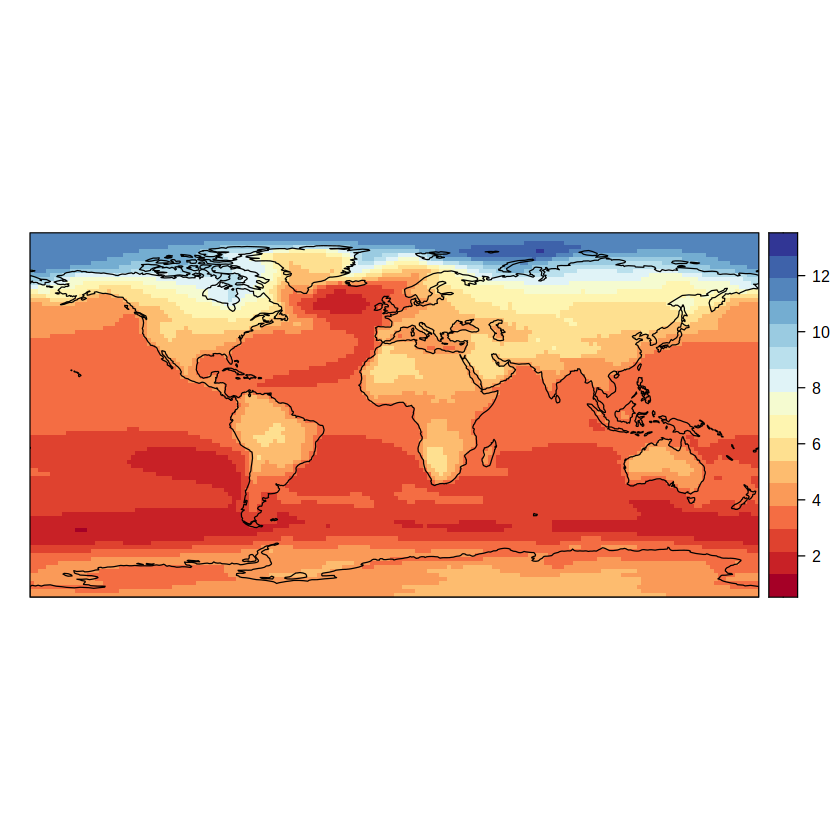
We can now use standard climate4R functions, such as spatialPlot to creat map figures.
spatialPlot(delta, backdrop.theme = "coastline")
Mask land#
We can now combine this information with other available in the repository. For instance, the masking surface for this example is provided as a NetCDF in the reference-grids folder. Therefore, we can load the corresponding mask (2 degrees for this CMIP5 example), and use it to select land-only data.
mask <- loadGridData("../reference-grids/land_sea_mask_2degree.nc4", var = "sftlf")
mask.land <- binaryGrid(mask, condition = "GT", threshold = 0.999, values = c(NA, 1))
Show code cell output
[2023-05-07 16:57:50] Defining geo-location parameters
[2023-05-07 16:57:50] Defining time selection parameters
NOTE: Undefined Dataset Time Axis (static variable)
[2023-05-07 16:57:50] Retrieving data subset ...
[2023-05-07 16:57:50] Done
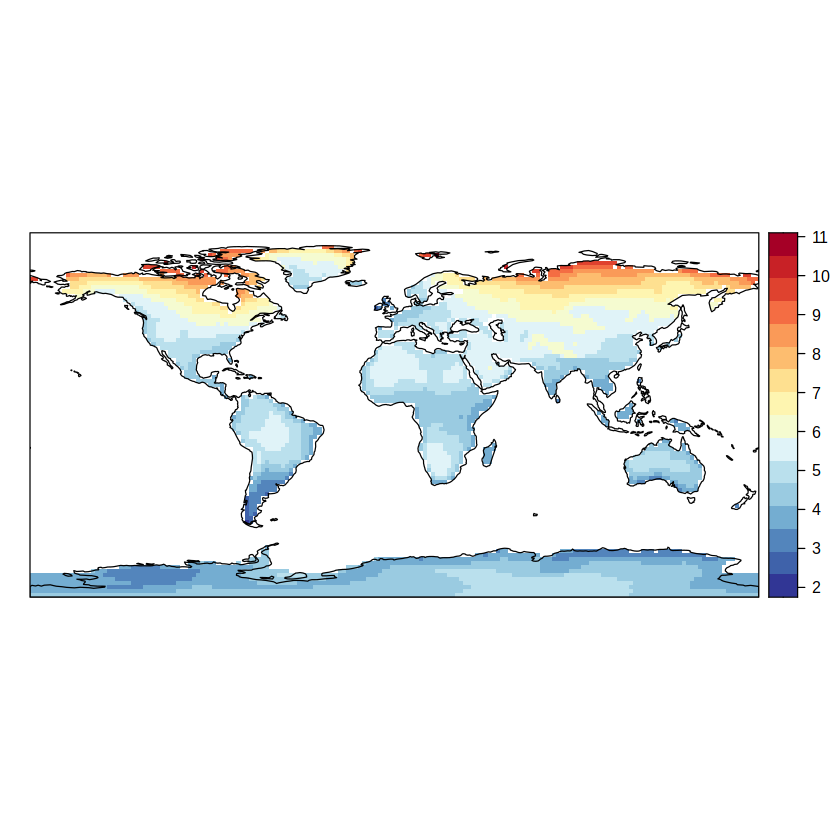
Here, we apply the mask using gridArithmetic (i.e. perfom delta x mask) and display it. We also reverse the default color scheme to have hot colors for larger warming.
delta.masked <- gridArithmetics(delta, mask.land, operator = "*")
spatialPlot(delta.masked, backdrop.theme = "coastline", rev.colors = TRUE)
Spatial subsetting#
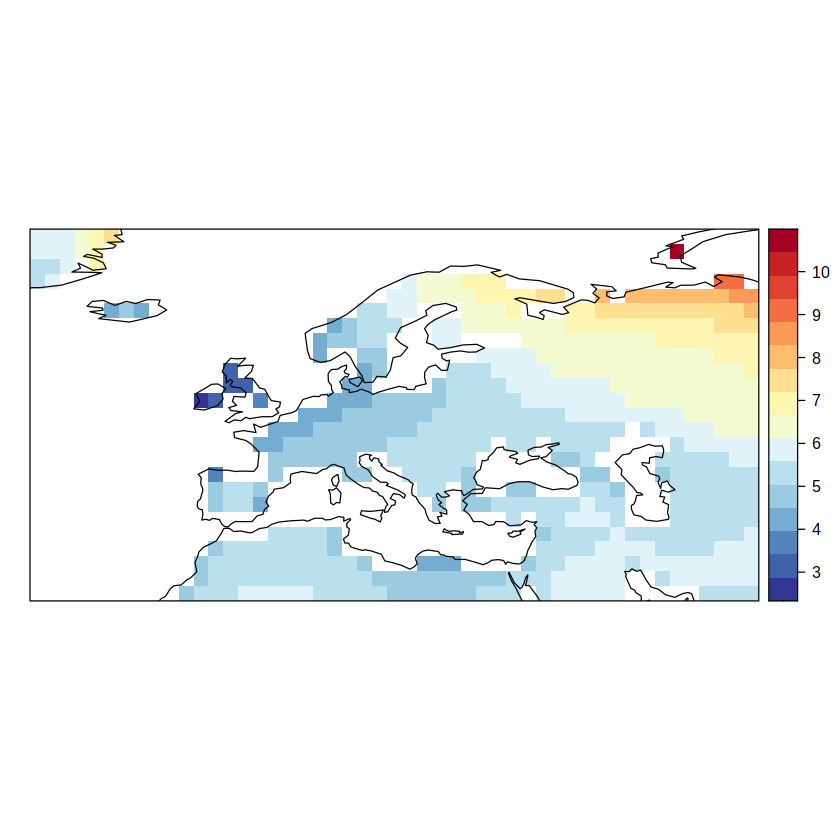
We can get a spatial subset with subsetGrid. E.g. for Europe.
delta.EU <- subsetGrid(delta.masked, lonLim = c(-30, 65), latLim = c(28, 75))
spatialPlot(delta.EU, backdrop.theme = "coastline", rev.colors = TRUE)
Or using the IPCC WGI reference regions.
regions <- get(load("../reference-regions/IPCC-WGI-reference-regions-v4_R.rda"))
regions <- as(regions, "SpatialPolygons")
proj4string(regions) <- CRS("+init=epsg:4326")
Show code cell output
Warning message in proj4string(obj):
“CRS object has comment, which is lost in output”
Warning message in `proj4string<-`(`*tmp*`, value = new("CRS", projargs = "+proj=longlat +datum=WGS84 +no_defs")):
“A new CRS was assigned to an object with an existing CRS:
+proj=longlat +ellps=WGS84 +no_defs
without reprojecting.
For reprojection, use function spTransform”
Define the original projection of the data (in this case is the same as the regions)
delta.masked <- projectGrid(delta.masked, proj4string(regions))
Warning message in proj4string(regions):
“CRS object has comment, which is lost in output”
Warning message in projectGrid(delta.masked, proj4string(regions)):
“CAUTION! Grid with previusly defined projection: +proj=longlat +datum=WGS84 +no_defs”
[2023-05-07 16:57:50] Arguments of the original projection defined as +proj=longlat +datum=WGS84 +no_defs
Select the desired regions by acronym. Display the names typing names(regions). Here we select the European regions:
regionnames <- c("NEU", "WCE", "EEU", "MED")
Get a Spatial subset by intersection with a polygons object
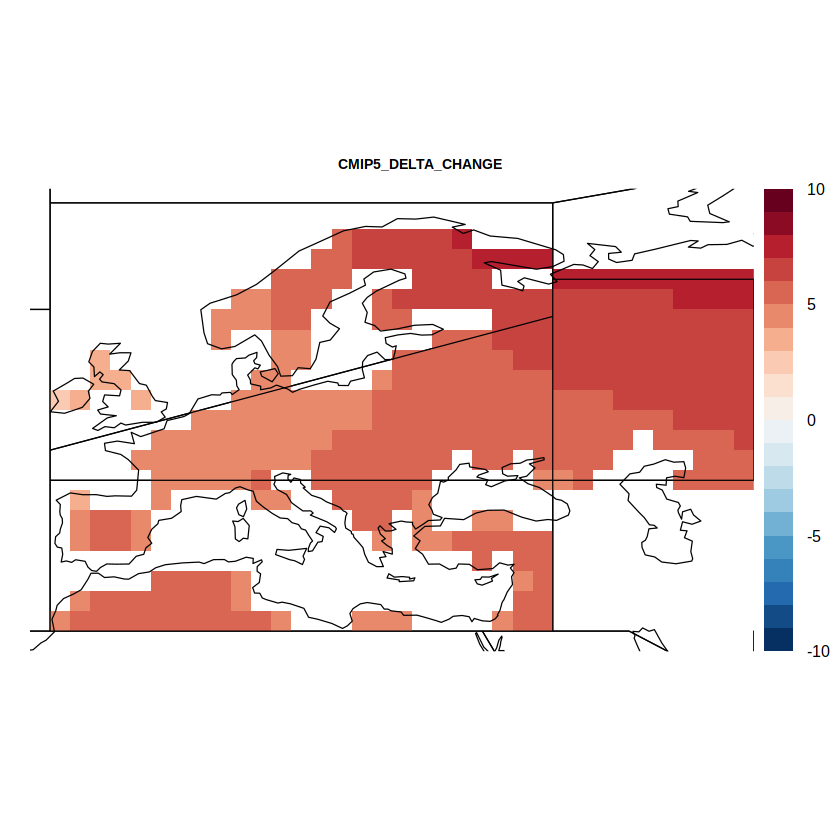
# Overly with reference regions
delta.masked.regs <- overGrid(delta.masked, regions[regionnames], subset = TRUE)

spatialPlot(delta.masked.regs,
            color.theme = "RdBu",
            rev.colors = TRUE,
            strip = FALSE,
            as.table = TRUE,
            backdrop.theme = "coastline",
            sp.layout = list(list(regions, first = FALSE)),
            par.settings = list(axis.line = list(col = "transparent")),
            main =  list("CMIP5_DELTA_CHANGE",
                         cex = 0.7),
            at = seq(-10, 10, 1),
            set.max = 10,
            set.min = -10)
Regional averages#
Calculate regional averages for each region using aggregateGrid
reg.averages <- sapply(regionnames, function(i){
      reg <- overGrid(delta.masked, regions[i])
      grid <- aggregateGrid(reg, aggr.spatial = list(FUN = "mean", na.rm = TRUE), weight.by.lat = TRUE)
      grid$Data
})
Calculating areal weights...
[2023-05-07 16:57:50] - Aggregating spatially...
[2023-05-07 16:57:50] - Done.
Calculating areal weights...
[2023-05-07 16:57:50] - Aggregating spatially...
[2023-05-07 16:57:50] - Done.
Calculating areal weights...
[2023-05-07 16:57:50] - Aggregating spatially...
[2023-05-07 16:57:50] - Done.
Calculating areal weights...
[2023-05-07 16:57:50] - Aggregating spatially...
[2023-05-07 16:57:50] - Done.
reg.averages
- NEU
- 5.50944918543635
- WCE
- 5.10750875150443
- EEU
- 6.19588630974501
- MED
- 5.06390992814719
Session info#
sessionInfo()
Show code cell output
R version 3.6.3 (2020-02-29)
Platform: x86_64-conda-linux-gnu (64-bit)
Running under: Fedora Linux 38 (Workstation Edition)

Matrix products: default
BLAS/LAPACK: /home/phanaur/mambaforge/envs/tfg/lib/libopenblasp-r0.3.21.so

locale:
 [1] LC_CTYPE=es_ES.UTF-8          LC_NUMERIC=C
 [3] LC_TIME=es_ES.UTF-8           LC_COLLATE=es_ES.UTF-8
 [5] LC_MONETARY=es_ES.UTF-8       LC_MESSAGES=es_ES.UTF-8
 [7] LC_PAPER=es_ES.UTF-8          LC_NAME=es_ES.UTF-8
 [9] LC_ADDRESS=es_ES.UTF-8        LC_TELEPHONE=es_ES.UTF-8
[11] LC_MEASUREMENT=es_ES.UTF-8    LC_IDENTIFICATION=es_ES.UTF-8

attached base packages:
[1] stats     graphics  grDevices utils     datasets  methods   base

other attached packages:
 [1] rgdal_1.5-16        sp_1.4-5            RColorBrewer_1.1-2
 [4] visualizeR_1.6.1    geoprocessoR_0.2.0  loadeR.2nc_0.1.2
 [7] loadeR_1.7.1        climate4R.UDG_0.2.3 loadeR.java_1.1.1
[10] rJava_1.0-4         transformeR_2.1.3

loaded via a namespace (and not attached):
 [1] viridis_0.6.1           maps_3.3.0              jsonlite_1.7.2
 [4] viridisLite_0.4.0       foreach_1.5.1           SpecsVerification_0.5-3
 [7] R.utils_2.10.1          dotCall64_1.0-1         kohonen_3.0.10
[10] sm_2.2-5.6              latticeExtra_0.6-29     pillar_1.6.1
[13] lattice_0.20-44         glue_1.4.2              RcppEigen_0.3.3.9.1
[16] uuid_0.1-4              digest_0.6.27           colorspace_2.0-1
[19] htmltools_0.5.1.1       Matrix_1.3-3            R.oo_1.24.0
[22] pkgconfig_2.0.3         raster_3.4-10           padr_0.5.3
[25] purrr_0.3.4             scales_1.1.1            CircStats_0.2-6
[28] jpeg_0.1-8.1            proxy_0.4-25            dtw_1.22-3
[31] tibble_3.1.2            generics_0.1.0          ggplot2_3.3.3
[34] ellipsis_0.3.2          repr_1.1.3              pbapply_1.4-3
[37] verification_1.42       gdalUtils_2.0.3.2       easyVerification_0.4.4
[40] magrittr_2.0.1          crayon_1.4.1            evaluate_0.14
[43] R.methodsS3_1.8.1       ncdf4_1.17              fansi_0.4.2
[46] MASS_7.3-54             data.table_1.14.0       tools_3.6.3
[49] lifecycle_1.0.0         munsell_0.5.0           akima_0.6-2.1
[52] compiler_3.6.3          mapplots_1.5.1          rlang_0.4.11
[55] grid_3.6.3              RCurl_1.98-1.3          pbdZMQ_0.3-5
[58] iterators_1.0.13        IRkernel_1.2            spam_2.6-0
[61] bitops_1.0-7            tcltk_3.6.3             base64enc_0.1-3
[64] vioplot_0.3.6           boot_1.3-28             gtable_0.3.0
[67] codetools_0.2-18        abind_1.4-5             R6_2.5.0
[70] zoo_1.8-9               gridExtra_2.3           dplyr_1.0.6
[73] utf8_1.2.1              parallel_3.6.3          IRdisplay_1.0
[76] Rcpp_1.0.6              fields_12.3             vctrs_0.3.8
[79] png_0.1-7               tidyselect_1.1.1