# Atlas notebooks
***
> This notebook reproduces and extends parts of the figures and products of the AR6-WGI Atlas. It is part of a notebook collection available at https://github.com/IPCC-WG1/Atlas for reproducibility and reusability purposes. This work is licensed under a [Creative Commons Attribution 4.0 International License](http://creativecommons.org/licenses/by/4.0).
>
> 
Create stripes of anual temperature and precipitation mean values.#
13/7/2021
M. Iturbide (Santander Meteorology Group. Institute of Physics of Cantabria, CSIC-UC, Santander, Spain).
This notebook creates stripes figures using data from datasets-aggregated-regionally. The resulting figures show years in the x axis and model names in the y axis. Despite mean results are shown for each model and year, the values are not necessarily annual, as the user can select the season of interest.
Load packages and functions#
This notebook is based on the R programming language and requires packages:
magrittrto pipe (%>%) sequences of operationshttrto handle URLs and HTTPlatticeandlatticeExtrato produce the figuresRColorBrewerfor producing color palettes
library(magrittr)
library(httr)
library(lattice)
library(latticeExtra)
library(RColorBrewer)
The main function to generate the stripes is computeStripes, available in this repository. To load this functions in the working environment use the source R base function as follows.
source("../datasets-aggregated-regionally/scripts/computeStripes.R")
The script is available for download:
computeStripes.R
Compute the stripes#
Parameters description#
Here is a brief description of the computeStripes parameters and available choices for different configurations:
projectAny of the following character strings: “CMIP6”, “CMIP5” “CORDEX”.varAny of the following: “tas” (for temperature) “pr” (for precipitation).experimentAny of the following strings for CORDEX and CMIP5: rcp26, rcp45, rcp85. Any of the following for CMIP6:”ssp126”, “ssp245”, “ssp370”, “ssp585”. Additionally, the historical scenario is always used as reference.seasonNumerical value indicating the target season (e.g. 1:12 for annual data, c(12, 1, 2) for winter).areaAny of the following: “land”, “sea”, “landsea”.regionAcronym of any of the reference regions (e.g. “MED”) or “World” (or “full_domain” if project = “CORDEX”).cordex.domainAny of the following character strings: “AFR”, “ANT”, “ARC”, “AUS”, “CAM”, “EAS”, “EUR”, “NAM”, “SAM”, “SEA”, “WAS”. Used only if project = “CORDEX”. If the region selected does not intersect the cordex domain, other domain is used and a warning message is printed.brewer.pal.nameBrewer color palette name (e.g. “RdBu”).rev.colorsLogical indicating whether the color palette should be reversed....Optional graphical parameters of the levelplot function (type ?levelplot).
In the following cells we will play play with these paremeters to produce different results.
Stripes of global mean values for CMIP6#
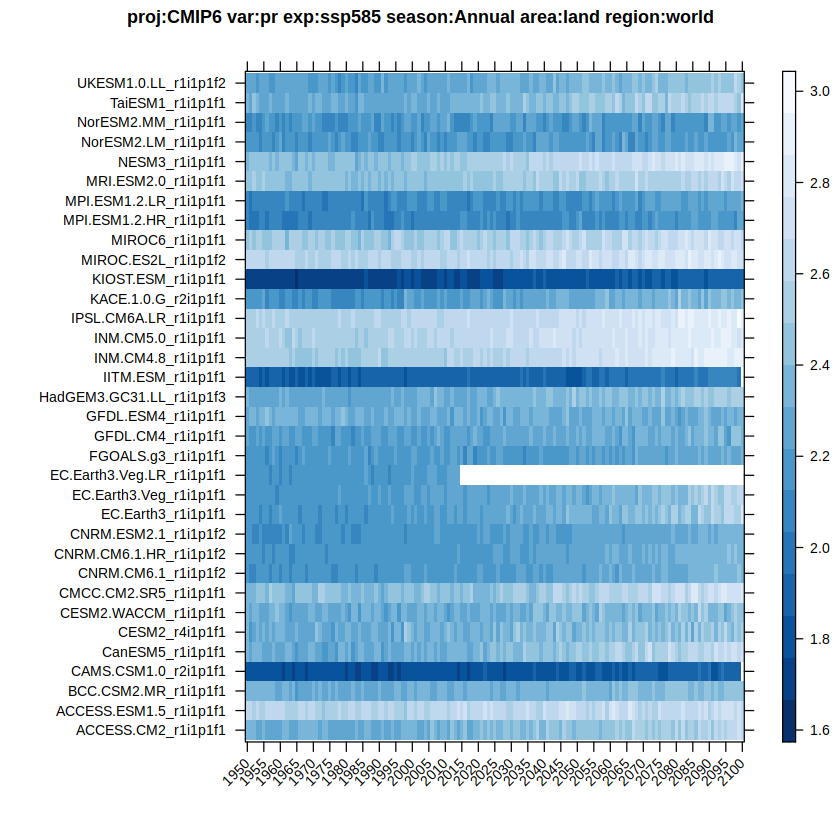
The next call of computeStripes produces a stripes figure for CMIP6 (project = "CMIP6") annual (season = 1:12) mean precipitation (var = "pr"). The historical and ssp585 scenarios are considered (experiment = "ssp585") for the global land surface (region = "world" and area = "land").
computeStripes(project = "CMIP6",
               var = "pr",
               experiment = "ssp585",
               season = 1:12,
               area = "land",
               region = "world",
               cordex.domain = NULL,
               brewer.pal.name = "Blues",
               rev.colors = TRUE)
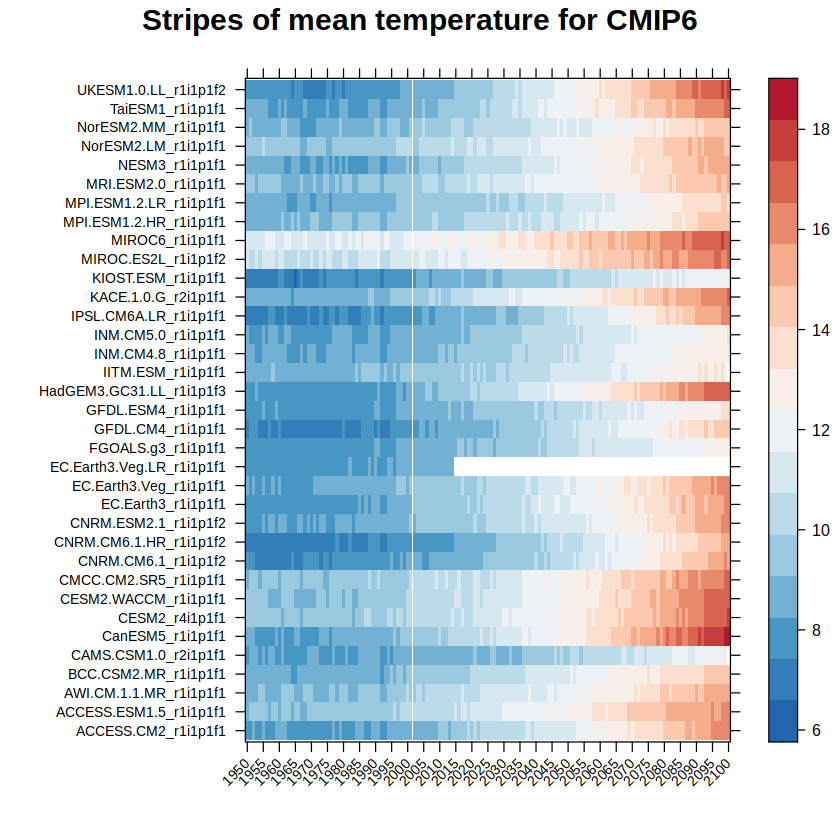
Play with the parameter options for different configurations. For instance, change the variable (var = "tas") or use additional graphical parameters (type ?levelplot to check available parameters) to, for instance, change the title (main = list("Stripes of Mediterranean mean temperature for CMIP6", cex = 1.5)) or the width of the colorkey (colorkey = list(width = 2)).
computeStripes(project = "CMIP6",
               var = "tas",
               experiment = "ssp585",
               season = 1:12,
               area = "land",
               region = "world",
               cordex.domain = NULL,
               brewer.pal.name = "RdBu",
               rev.colors = TRUE,
               main = list("Stripes of mean temperature for CMIP6", cex = 1.5),
               colorkey = list(width = 2))
Regional stripes#
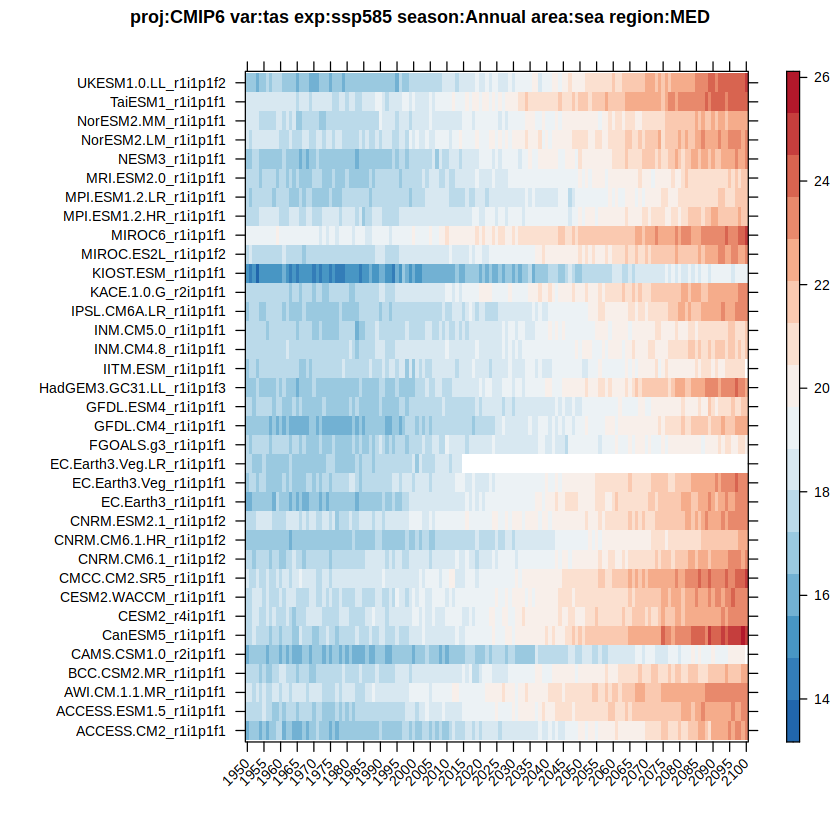
Use the name of any of the reference regions available in this repository, for instance “MED” (Mediterranean) in the next example. As “MED” can be considered both land or sea, here we will select the mediterranean sea:
computeStripes(project = "CMIP6",
               var = "tas",
               experiment = "ssp585",
               season = 1:12,
               area = "sea",
               region = "MED",
               cordex.domain = NULL,
               brewer.pal.name = "RdBu",
               rev.colors = TRUE)
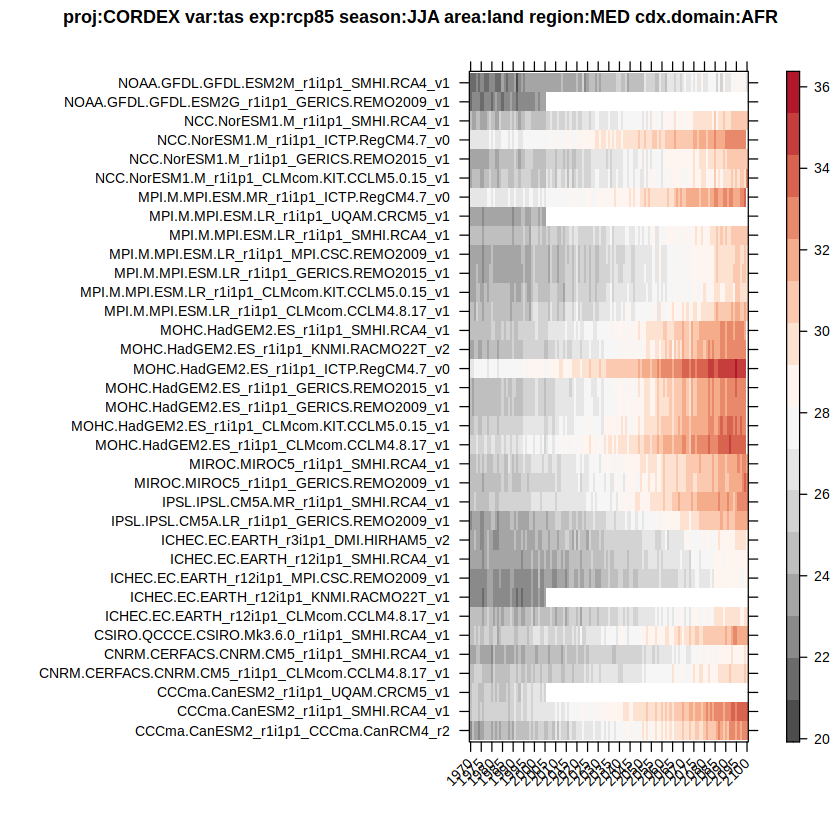
Lets consider summer values for CORDEX (season = 6:8 and project = "CORDEX"). We need to specify a CORDEX domain, for instance cordex.domain = "AFR" (we could also select “EUR”, as both domains cover the MED region). We will also change the color palette (brewer.pal.name = "RdGy")
computeStripes(project = "CORDEX",
               var = "tas",
               experiment = "rcp85",
               season = 6:8,
               area = "land",
               region = "MED",
               cordex.domain = "AFR",
               brewer.pal.name = "RdGy",
               rev.colors = TRUE)
sessionInfo()
Show code cell output
R version 3.6.3 (2020-02-29)
Platform: x86_64-conda-linux-gnu (64-bit)
Running under: Fedora Linux 38 (Workstation Edition)

Matrix products: default
BLAS/LAPACK: /home/phanaur/mambaforge/envs/tfg/lib/libopenblasp-r0.3.21.so

locale:
 [1] LC_CTYPE=es_ES.UTF-8       LC_NUMERIC=C
 [3] LC_TIME=es_ES.UTF-8        LC_COLLATE=es_ES.UTF-8
 [5] LC_MONETARY=es_ES.UTF-8    LC_MESSAGES=es_ES.UTF-8
 [7] LC_PAPER=es_ES.UTF-8       LC_NAME=C
 [9] LC_ADDRESS=C               LC_TELEPHONE=C
[11] LC_MEASUREMENT=es_ES.UTF-8 LC_IDENTIFICATION=C

attached base packages:
[1] stats     graphics  grDevices utils     datasets  methods   base

other attached packages:
[1] RColorBrewer_1.1-2  latticeExtra_0.6-29 lattice_0.20-44
[4] httr_1.4.2          magrittr_2.0.1

loaded via a namespace (and not attached):
 [1] uuid_0.1-4        R6_2.5.0          jpeg_0.1-8.1      rlang_0.4.11
 [5] fansi_0.4.2       tools_3.6.3       grid_3.6.3        png_0.1-7
 [9] utf8_1.2.1        htmltools_0.5.1.1 ellipsis_0.3.2    digest_0.6.27
[13] lifecycle_1.0.0   crayon_1.4.1      IRdisplay_1.0     repr_1.1.3
[17] base64enc_0.1-3   vctrs_0.3.8       IRkernel_1.2      evaluate_0.14
[21] pbdZMQ_0.3-5      compiler_3.6.3    pillar_1.6.1      jsonlite_1.7.2